
Serving where need is greatest
Nearly one in three neighbors in Cook and Lake counties struggles to make ends meet. Whether providing food for their families, support as they find and move into homes of their own, or connections to other programs and partners, Catholic Charities welcomes our neighbors in need with arms wide open.
Economic inequality
Income inequality in the U.S. has ballooned over the last 50 years. By 2024, the top 20% of households had a mean income 17 times that of the bottom 20%, and their numbers have increased by 60%. More than 40% of households have an income of less than $50,000.
Mean income received by each quintile and top 5%
U.S. Households:
1967 to 2024 (in 2024 dollars)


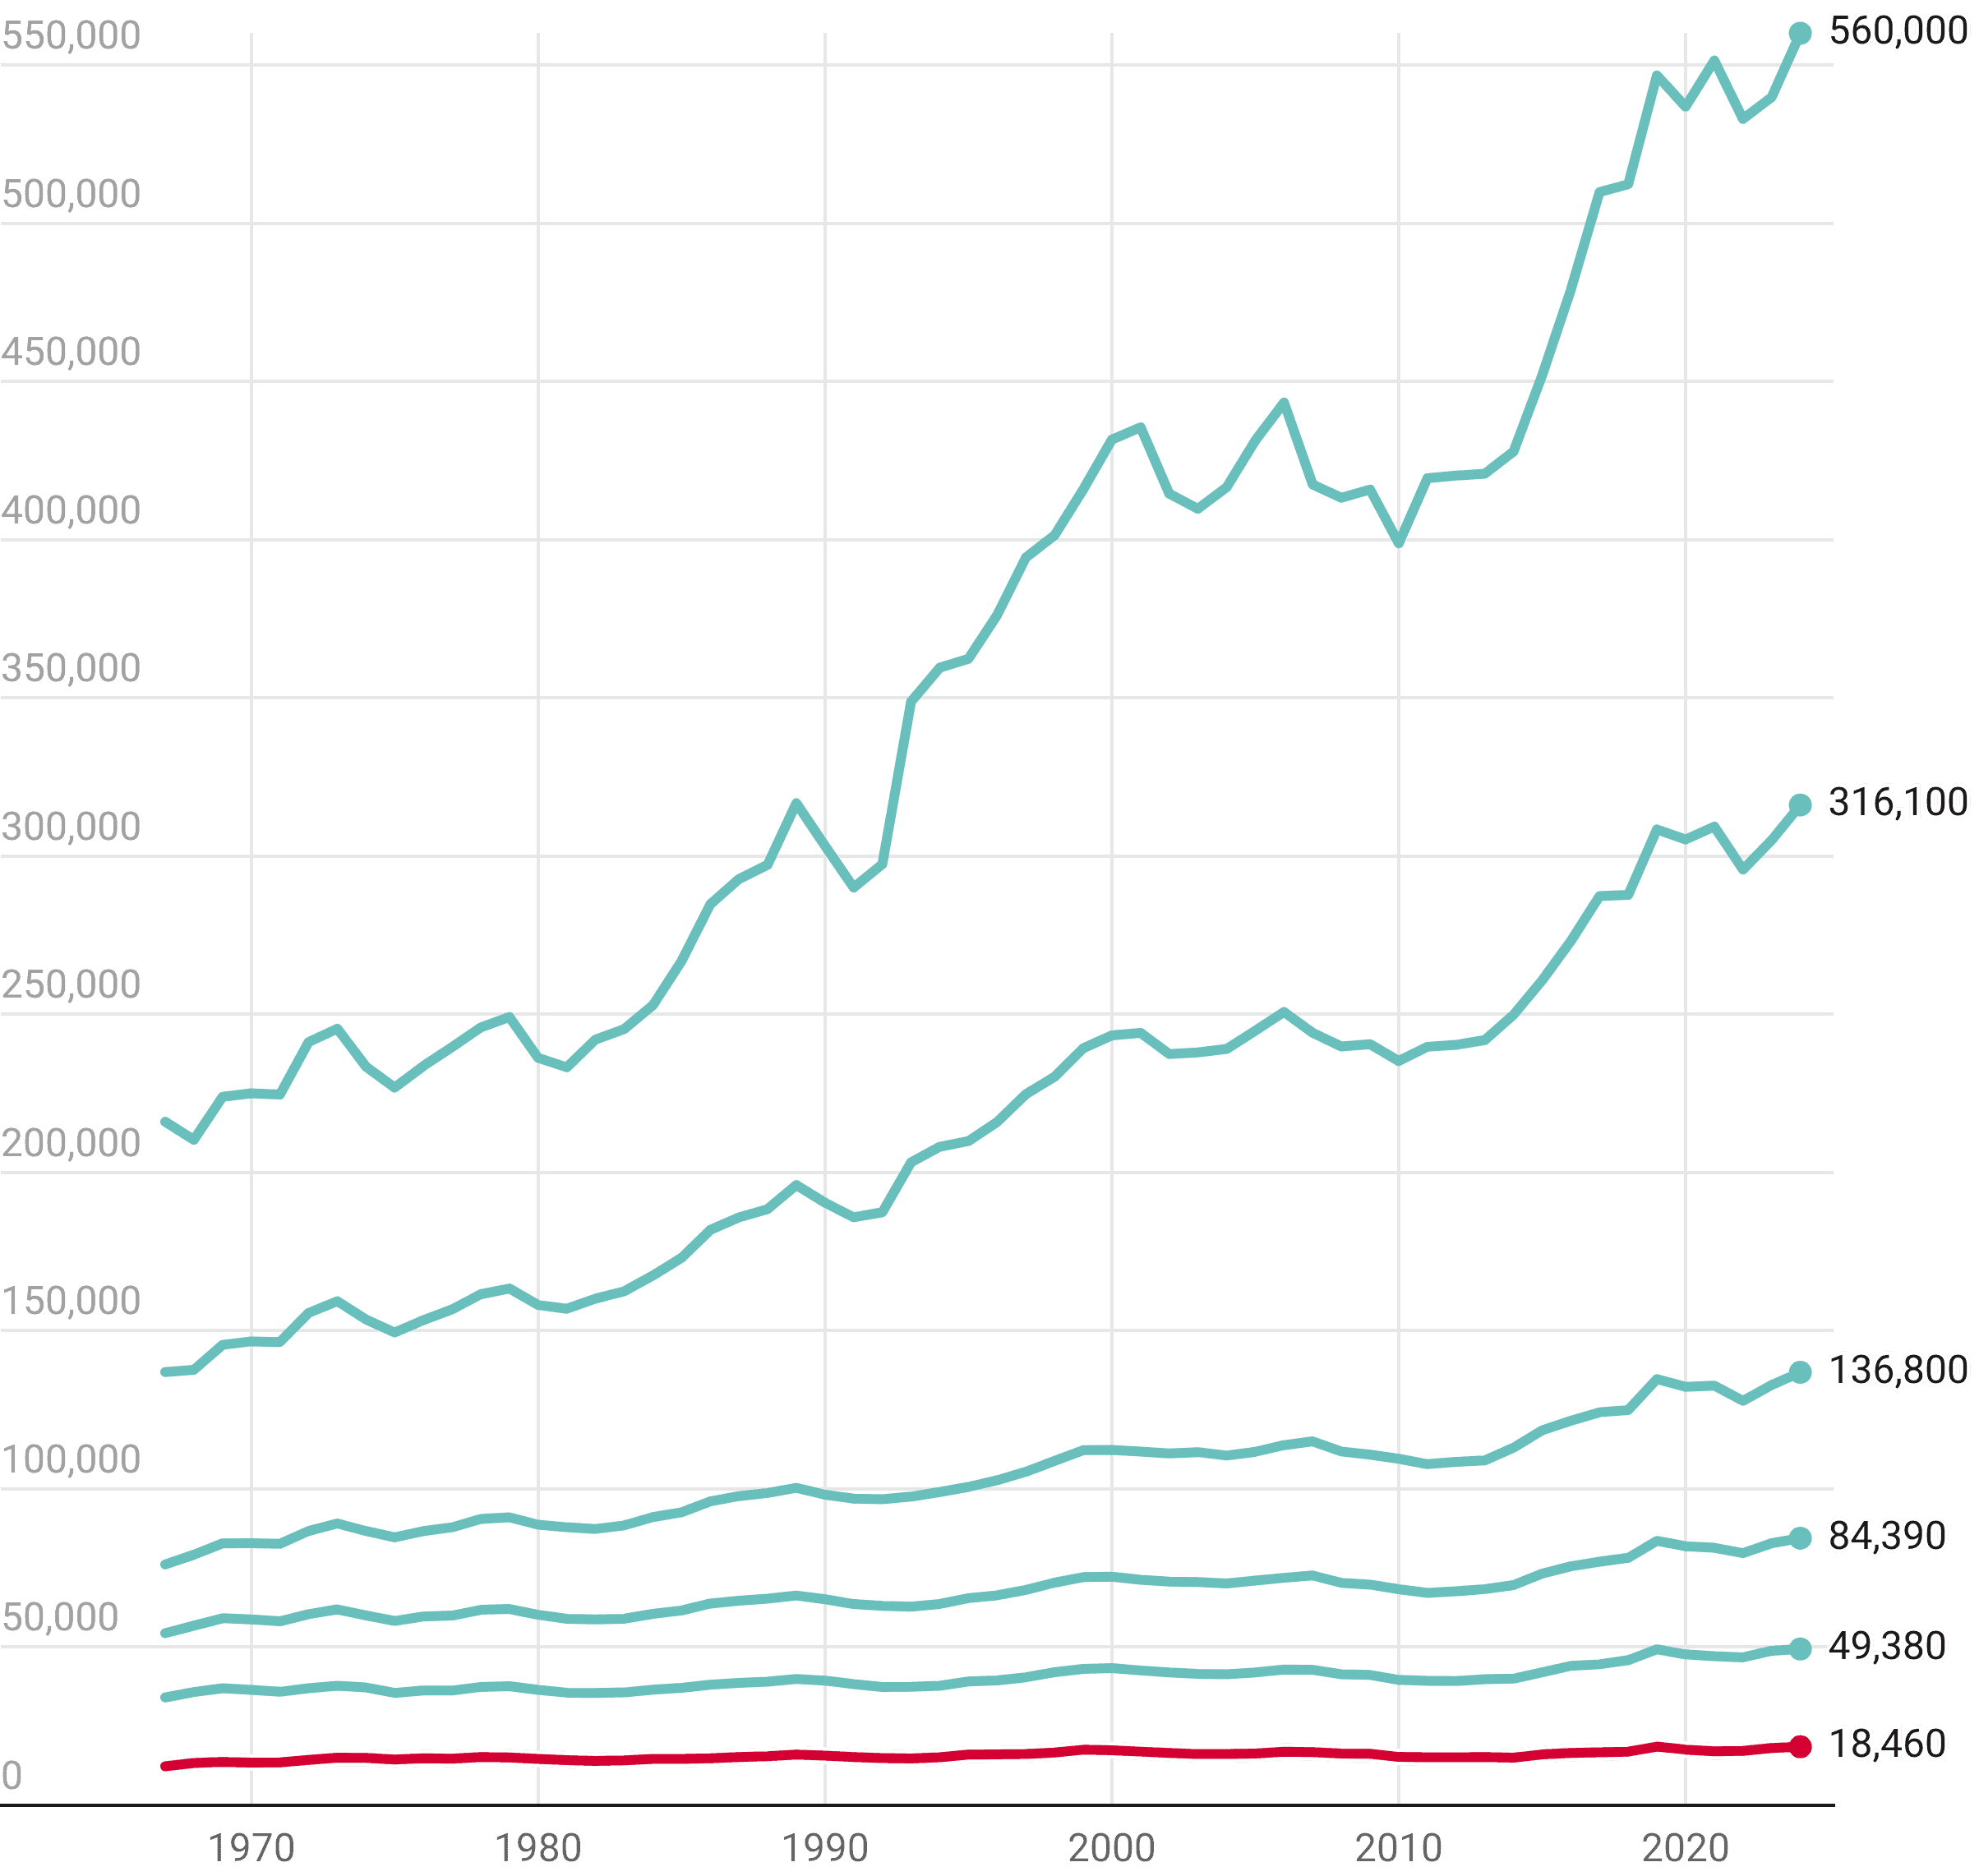
Source: U.S. Census Bureau, Current Population Survey,
1968 to 2025 Annual Social and Economic Supplements (CPS ASEC)
What does this mean for the communities we serve?
Today, 2 million of our region’s 6 million residents struggle to afford everyday household expenses.
Research estimates that survival budgets — covering the bare minimum of goods and services — require incomes about twice as high as federal poverty thresholds. Many people we serve are working families and seniors living on fixed incomes. With inflation and government budget cuts, they are increasingly turning to the region’s safety net for assistance to fill the gaps.
In more than half of the communities across Cook and Lake counties, more than 20% of people are earning less than a survival budget.
Percentage of low income households by zip code
Low income households are defined as at or below 200% of the poverty line: $31,920 for a single person per year; $66,000 for a family of four.

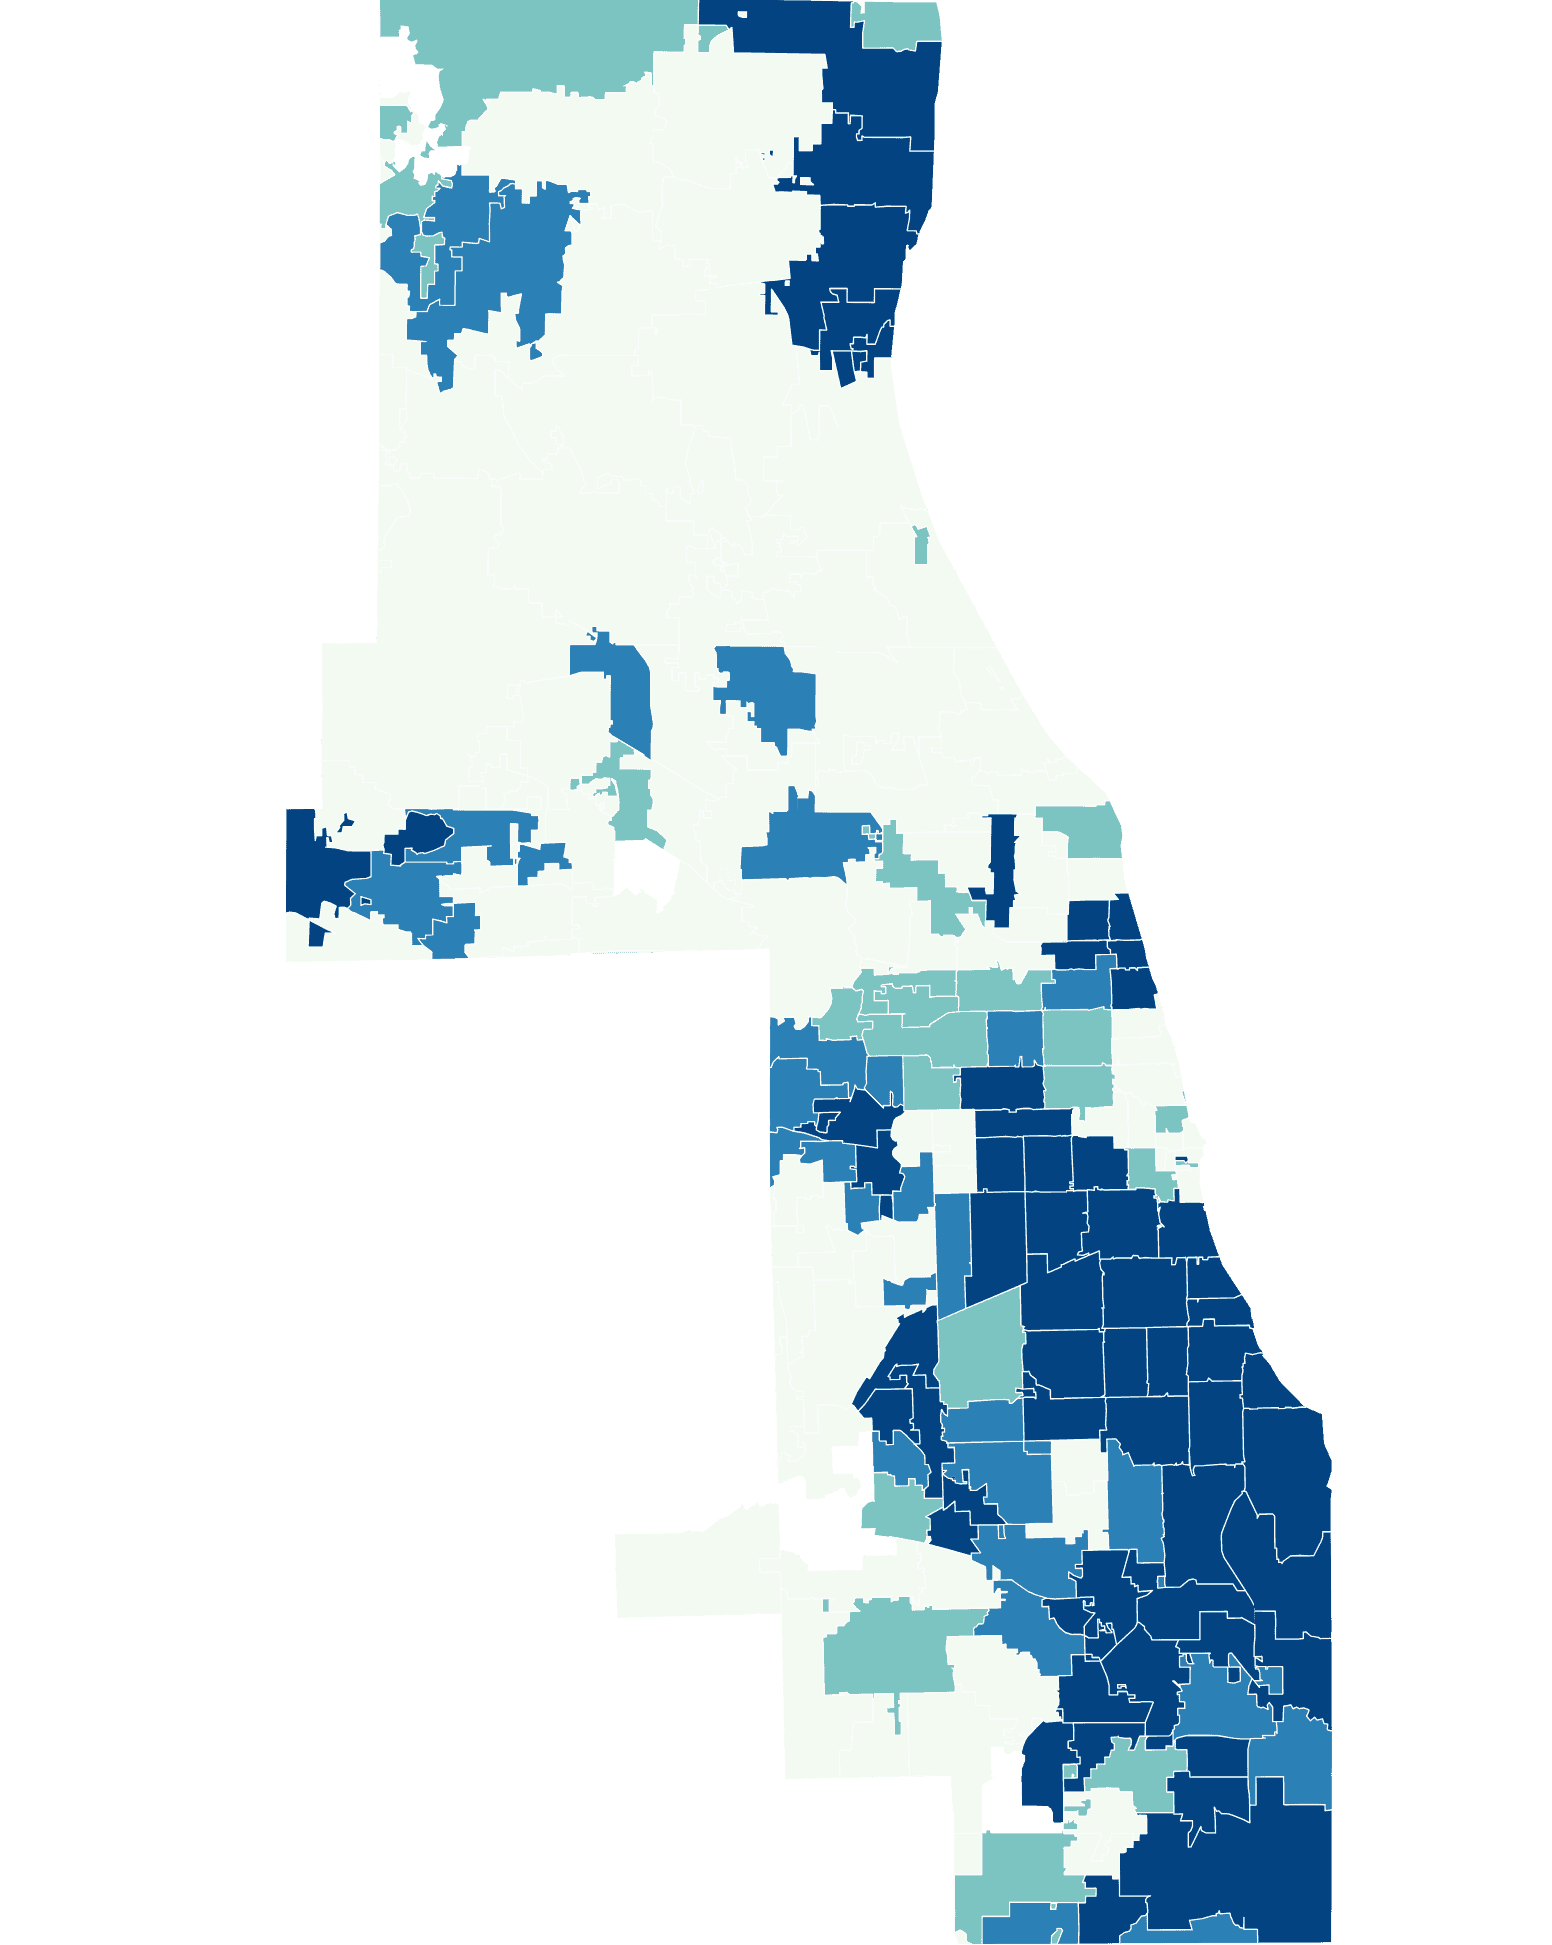
American Community Survey, ACS 5-Year Estimates Subject Tables, Table S1701, 2024
Source: U.S. Census Bureau, U.S. Department of Commerce
The facts behind the economic vulnerability of our neighbors
But we also know that poverty disproportionately impacts seniors who live alone, Black and Latino households, and households led by single mothers.
Seniors who live alone
27%
of seniors living alone
14%
of all seniors
Black and Latino households
18-20%
of Black households
15-17%
of Latino households
10%
of White households
Single parent families
35%
of families led by single mothers live below the poverty line
15%
of single fathers
6%
of intact families
27%
of all households with children under 18 are led by single mothers
17%
of all children live below the poverty line